© A.W.Marczewski 2002
A Practical Guide to Isotherms of ADSORPTION on Heterogeneous Surfaces
Reload Adsorption Guide
Experimental examples of t-plot and αs-plot
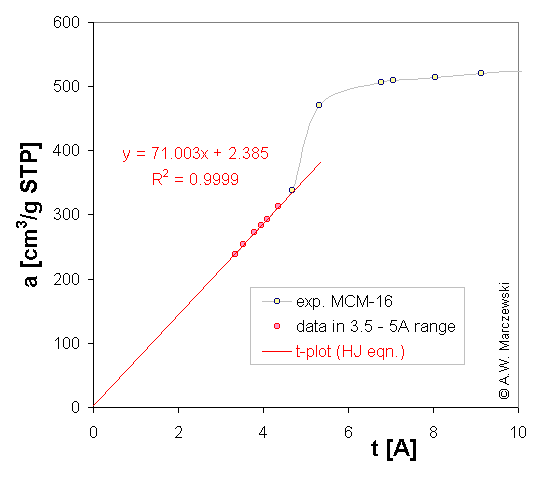
 t-plot for MCM-16 silica sample (A. Derylo-Marczewska et al.) (compare with αs-plot below).
Straight line calculated according to Harkins-Jura (HJ) isotherm equation.
y-intercept is used to calculate the total volume of micropores. The slope is used to calculate the "external" surface area (i.e. here "external" is meso-, macropore and true external area)
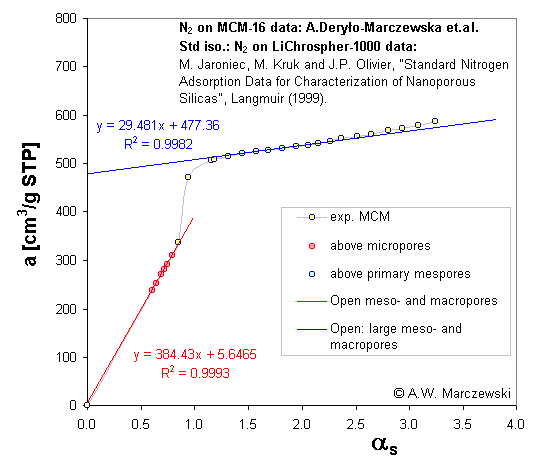
 αs-plot for MCM-16 silica sample (A. Derylo-Marczewska et al.) (compare with t-plot above).
Nitrogen data measured with ASAP-2405N sorption analyzer (Micromeritics). Standard isotherm by Jaroniec et al.
Two lines are plotted:
The red points and line (--o--) correspond to adsorption in meso- and macropores just above filling-up of micropores. The y-intercept corresponds to the already filled up micropores, whereas the magnitude of slope is related to the currently available "external" surface area (meso- and macropores).
The blue points and line (--o--) correspond to adsorption in large mesopores and macropores just above filling-up of primary mesopores. The y-intercept corresponds to the already filled up micropores and mesopores, whereas the magnitude of slope is related to the currently available "external" surface area (large mesopores and macropores).
Sudden increase of adsorption (with strongly negative y-intercept) just below αs = 1 (i.e. below p/ps = 0.4 - line not drawn) corresponds to condensation in primary mesopores.
Comparisons of αs vs. HJ, αs vs. Halsey and HJ vs. Halsey
 Comparison of αs given by Jaroniec et.al. (see example of αs-plot above) with Harkins-Jura statistical thickness, tHJ .
Both methods/isotherms are almost equivalent in the critical region used for estimation of micropore volume and external surface area (3.5 - 5A) - see straight line. However, they become different for larger adsorptions.
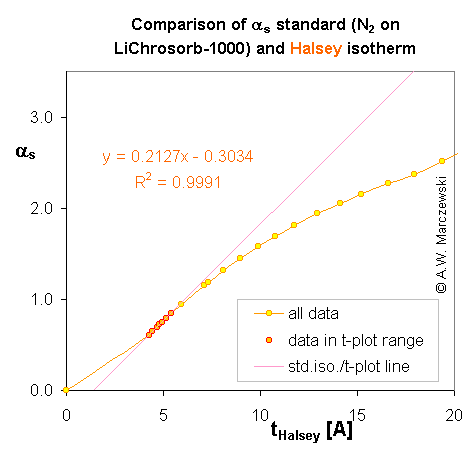
 Comparison of αs given by Jaroniec et.al. (see example of αs-plot above) with Halsey eq. statistical thickness, tHalsey .
Statistical N2 thickness given by Halsey eq. is strongly incompatible with experimental data of Jaroniec et. al. as well as HJ equation (compare HJ figure above; see also comparison of HJ and Halsey - below). However, though for microporous solids Halsey estimates may be useful, it should be avoided, as t-plot with HJ and αs-method give much more reliable results.
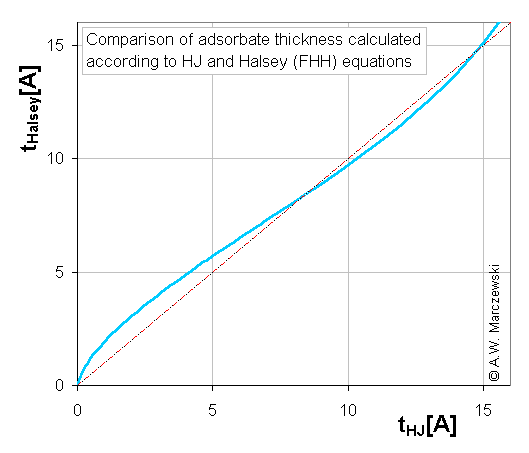
 Comparison of of Harkins-Jura (HJ) statistical adsorbate thickness HJ with Halsey eq. statistical thickness, tHalsey .
Statistical N2 thickness given by Halsey eq. is higher for low relative pressures (below 0.65), equal or sligthtly lower for moderate relative pressures (0.65 - 0.93) and again higher for high relative pressures (above 0.93). It may be used for only a crude approximations in t-plot method. It also results from author's experience, that t-plot method with Halsey equation often gives erroneous estimation of micropore volume - especially for macroporous or mesoporous materials (negative values). However, though for microporous solids Halsey estimates may be useful, it should be avoided, as t-plot with HJ and αs-method give much more reliable results (see above).
E-mail addresses are modified to in order to prevent spamming / mail-abuse:
in e-mail remove spaces, replace " AT@AT " by "@"
Send a message to Adam.Marczewski AT@AT umcs.lublin.pl
Disclaimer
 t-plot for MCM-16 silica sample (A. Derylo-Marczewska et al.) (compare with αs-plot below).


